|
GenScript corporation
u6 promoter:grna expression cassettes U6 Promoter:Grna Expression Cassettes, supplied by GenScript corporation, used in various techniques. Bioz Stars score: 90/100, based on 1 PubMed citations. ZERO BIAS - scores, article reviews, protocol conditions and more https://www.bioz.com/product/grna+expression/u6+promoter+grna+expression+cassettes/us10450576-720-2-9 Average 90 stars, based on 1 article reviews
u6 promoter:grna expression cassettes - by Bioz Stars,
2026-10
90/100 stars
|
Buy from Supplier |
|
GenScript corporation
grna expression cassette Grna Expression Cassette, supplied by GenScript corporation, used in various techniques. Bioz Stars score: 90/100, based on 1 PubMed citations. ZERO BIAS - scores, article reviews, protocol conditions and more https://www.bioz.com/product/grna+expression/grna+expression+cassette/pmc06737020-139-1-23 Average 90 stars, based on 1 article reviews
grna expression cassette - by Bioz Stars,
2026-10
90/100 stars
|
Buy from Supplier |
|
VectorBuilder GmbH
aav expressing grna- c4orf3  Aav Expressing Grna C4orf3, supplied by VectorBuilder GmbH, used in various techniques. Bioz Stars score: 90/100, based on 1 PubMed citations. ZERO BIAS - scores, article reviews, protocol conditions and more https://www.bioz.com/product/grna+expression/aav+expressing+grna+c4orf3/pmc12137002-380-9-17 Average 90 stars, based on 1 article reviews
aav expressing grna- c4orf3 - by Bioz Stars,
2026-10
90/100 stars
|
Buy from Supplier |
|
GenScript corporation
plasmids expressing 3 × grna Plasmids Expressing 3 × Grna, supplied by GenScript corporation, used in various techniques. Bioz Stars score: 90/100, based on 1 PubMed citations. ZERO BIAS - scores, article reviews, protocol conditions and more https://www.bioz.com/product/grna+expression/plasmids+expressing+3+%C3%97+grna/pm35562180-239-25-35 Average 90 stars, based on 1 article reviews
plasmids expressing 3 × grna - by Bioz Stars,
2026-10
90/100 stars
|
Buy from Supplier |
|
ToolGen Incorporated
grna expression plasmids prgen-u6-sgrna Grna Expression Plasmids Prgen U6 Sgrna, supplied by ToolGen Incorporated, used in various techniques. Bioz Stars score: 90/100, based on 1 PubMed citations. ZERO BIAS - scores, article reviews, protocol conditions and more https://www.bioz.com/product/grna+expression/grna+expression+plasmids+prgen+u6+sgrna/10__1074_slash_mcp__m116__062729-59-1-8 Average 90 stars, based on 1 article reviews
grna expression plasmids prgen-u6-sgrna - by Bioz Stars,
2026-10
90/100 stars
|
Buy from Supplier |
|
Genloci Biotechnologies Inc
grna expression oligos  Grna Expression Oligos, supplied by Genloci Biotechnologies Inc, used in various techniques. Bioz Stars score: 90/100, based on 1 PubMed citations. ZERO BIAS - scores, article reviews, protocol conditions and more https://www.bioz.com/product/grna+expression/grna+expression+oligos/pmc06722193-106-1-12 Average 90 stars, based on 1 article reviews
grna expression oligos - by Bioz Stars,
2026-10
90/100 stars
|
Buy from Supplier |
|
VectorBuilder GmbH
lentivirus containing either control or the dnajb6 grna expression construct Lentivirus Containing Either Control Or The Dnajb6 Grna Expression Construct, supplied by VectorBuilder GmbH, used in various techniques. Bioz Stars score: 90/100, based on 1 PubMed citations. ZERO BIAS - scores, article reviews, protocol conditions and more https://www.bioz.com/product/grna+expression/dnajb6+grna+expression+construct/pm40412548-60-1-11 Average 90 stars, based on 1 article reviews
lentivirus containing either control or the dnajb6 grna expression construct - by Bioz Stars,
2026-10
90/100 stars
|
Buy from Supplier |
|
GenScript corporation
senp7-targeting grna-expressing plasmid (plenticrispr Senp7 Targeting Grna Expressing Plasmid (Plenticrispr, supplied by GenScript corporation, used in various techniques. Bioz Stars score: 90/100, based on 1 PubMed citations. ZERO BIAS - scores, article reviews, protocol conditions and more https://www.bioz.com/product/grna+expression/senp7+targeting+grna+expressing+plasmid++plenticrispr/pmc05271409-241-8-13 Average 90 stars, based on 1 article reviews
senp7-targeting grna-expressing plasmid (plenticrispr - by Bioz Stars,
2026-10
90/100 stars
|
Buy from Supplier |
|
GenScript corporation
soybean ( glycine max ) u6 small nuclear rna promoters u6-9-1 and u6-13-1 Soybean ( Glycine Max ) U6 Small Nuclear Rna Promoters U6 9 1 And U6 13 1, supplied by GenScript corporation, used in various techniques. Bioz Stars score: 90/100, based on 1 PubMed citations. ZERO BIAS - scores, article reviews, protocol conditions and more https://www.bioz.com/product/grna+expression/pgcas9++expressing+cassette+and+u6+promoter++grna+backbone/pmc04587461-447-12-25 Average 90 stars, based on 1 article reviews
soybean ( glycine max ) u6 small nuclear rna promoters u6-9-1 and u6-13-1 - by Bioz Stars,
2026-10
90/100 stars
|
Buy from Supplier |
|
BioCat GmbH
grna plasmids expressing double dual guide rnas Grna Plasmids Expressing Double Dual Guide Rnas, supplied by BioCat GmbH, used in various techniques. Bioz Stars score: 90/100, based on 1 PubMed citations. ZERO BIAS - scores, article reviews, protocol conditions and more https://www.bioz.com/product/grna+expression/grna+plasmids+expressing+double+dual+guide+rnas/pm39011887-62-1-11 Average 90 stars, based on 1 article reviews
grna plasmids expressing double dual guide rnas - by Bioz Stars,
2026-10
90/100 stars
|
Buy from Supplier |
|
VectorBuilder GmbH
a grna expression vector targeting human mmp3 (cat. no. vb170623-1031qnn)  A Grna Expression Vector Targeting Human Mmp3 (Cat. No. Vb170623 1031qnn), supplied by VectorBuilder GmbH, used in various techniques. Bioz Stars score: 90/100, based on 1 PubMed citations. ZERO BIAS - scores, article reviews, protocol conditions and more https://www.bioz.com/product/grna+expression/a+gRNA+expression+vector+targeting+human+MMP3++Cat++No++VB170623+1031qnn/bio_rxiv__2021__10__20__465221-141-46-7 Average 90 stars, based on 1 article reviews
a grna expression vector targeting human mmp3 (cat. no. vb170623-1031qnn) - by Bioz Stars,
2026-10
90/100 stars
|
Buy from Supplier |
|
VectorBuilder GmbH
grna expression vectors Grna Expression Vectors, supplied by VectorBuilder GmbH, used in various techniques. Bioz Stars score: 90/100, based on 1 PubMed citations. ZERO BIAS - scores, article reviews, protocol conditions and more https://www.bioz.com/product/grna+expression/grna+expression+vectors/pmc12151536-198-1-10 Average 90 stars, based on 1 article reviews
grna expression vectors - by Bioz Stars,
2026-10
90/100 stars
|
Buy from Supplier |
Image Search Results
Journal: Cell metabolism
Article Title: Identification of a molecular resistor that controls UCP1-independent Ca 2+ cycling thermogenesis in adipose tissue
doi: 10.1016/j.cmet.2025.03.009
Figure Lengend Snippet: (A) FPKM of indicated SERCA-binding peptides in isolated beige adipocytes of mice. n = 3. (B) Relative C4orf3/ALN protein expression levels in microsomes from IngWAT of UCP1 KO mice at the corresponding temperature. Calreticulin was used as a loading control. n = 3. Statistic: one-way ANOVA with Tukey’s post hoc HSD test. (C) Protein interaction between SERCA2b and endogenous C4orf3/ALN protein in beige adipocytes. Immunoprecipitants of a SERCA2 complex (FLAG-tagged) were immunoblotted using a polyclonal antibody for C4orf3. Inputs were included in the immunoblotting. (D) Endogenous C4orf3 protein expression in IngWAT of C4orf3 CRISPRi mice and control male mice. β-actin was used as a loading control. n = 3. (E) Intracellular Ca 2+ flux assay in IngWAT-derived adipocytes from control and C4orf3 CRISPRi mice. Primary adipocytes were differentiated on collagen-coated glass-bottom dishes in which intercellular Ca 2+ levels were determined by using the Fluo-8 dye. Control, n = 50; C4orf3 CRISPRi , n = 50. Statistic: two-way ANOVA with Šídák’s multiple comparisons test. (F) Ca 2+ uptake in isolated microsomes from the inguinal WAT of male C4orf3 CRISPRi mice and control mice at pCa 2+ 6.0. n = 5. (G) SERCA ATP hydrolysis assay in isolated microsomes from (F). (H) The bioenergetic efficiency of SERCA2 was calculated by Ca 2+ uptake per ATP hydrolysis from (E) and (F). (I) Heat rate in isolated microsomes from IngWAT of control and C4orf3 CRISPRi male mice in the presence of ATP and Ca 2+ (pCa 6.0). Thapsigargin was added to calculate SERCA-dependent thermogenesis. n = 5. (J) Relative mRNA levels of C4orf3 in adult dCas9-KRAB male mice 2 weeks after direct injection into IngWAT of AAV expressing scrambled control or gRNA targeting C4orf3 . n = 4. (K) Heat rate in isolated microsomes from the inguinal WAT of dCas9-KRAB male mice 2 weeks after AAV injection into the inguinal WAT. n = 4. Statistic (D and F–K): unpaired t test. Bars represent the mean and error shown as SEM.
Article Snippet: Ing WAT-specific C4orf3 KD mice were generated by injecting
Techniques: Binding Assay, Isolation, Expressing, Control, Western Blot, Flux Assay, Derivative Assay, Hydrolysis Assay, Injection

Journal: Cell metabolism
Article Title: Identification of a molecular resistor that controls UCP1-independent Ca 2+ cycling thermogenesis in adipose tissue
doi: 10.1016/j.cmet.2025.03.009
Figure Lengend Snippet: (A) Side (left) and top (right) views of the SERCA2b-C4ORF3 complex structure predicted by AlphaFold3. The A-, N-, P-, and TM domains of Ca 2+ -unbound SERCA2b are shown in orange, pink, yellow, and green, respectively. C4ORF3/ALN is shown in blue. (B) Protein interaction interface of SERCA2b to C4orf3 as determined by the Turbo-ID proximity-labeling proteomics. Turbo-tag was fused to the N terminus (the cytoplasmic side) of C4orf3. Orange, TM domain; yellow, actuator domain; pink, nucleotide-binding domain; cyan, P-domain. (C) Cross-linking assays of SERCA2b with C4orf3/ALN W48C in isolated microsomes at indicated SERCA2 catalytic states. The cross-linker BMH was added to induce the SERCA2-C4ORF3 complex formation. The assays were performed in three independent biological samples. Bottom: catalytic cycle of SERCA to transport Ca 2+ into the ER lumen. Indicated compounds were used to induce the specific catalytic states of SERCA. (D) The amino acid sequence alignment of C4ORF3. The lower panel shows the schematics of a C4ORF3 mutant containing only the transmembrane (TM) domain and three mutants (mutants A, B, and C) lacking the evolutionarily conserved domains (shown in red boxes). (E) Ca 2+ uptake in isolated microsomes from cells co-expressing SERCA2b together with empty vector control and indicated C4ORF3 constructs at pCa 2+ 6.0. n = 3. (F) SERCA ATP hydrolysis assay in microsomes from (E). (G) ITC-based thermogenesis assays from microsomes in (E). Statistic (E–G): one-way ANOVA with Tukey’s post hoc HSD test. Bars represent the mean and error shown as SEM.
Article Snippet: Ing WAT-specific C4orf3 KD mice were generated by injecting
Techniques: Labeling, Binding Assay, Isolation, Sequencing, Mutagenesis, Expressing, Plasmid Preparation, Control, Construct, Hydrolysis Assay

Journal: Cell metabolism
Article Title: Identification of a molecular resistor that controls UCP1-independent Ca 2+ cycling thermogenesis in adipose tissue
doi: 10.1016/j.cmet.2025.03.009
Figure Lengend Snippet: (A) Cold tolerance test of male C4orf3 CRISPRi mice and littermate controls. Mice kept at room temperature were exposed to cold (6°C) for indicated time points. n = 11. Statistic: two-way ANOVA with Šídák’s multiple comparisons test. (B) OCR in iBAT and IngWAT of male C4orf3 CRISPRi mice and control male mice following cold exposure. A subset of isolated tissues was stimulated with NE. n = 12 per group for iBAT; 10 per group for Ing WAT. Statistic: Mann-Whitney U test. (C) Relative mRNA expression of thermogenic genes in IngWAT of male mice following cold exposure. n = 5. (D) Mitochondrial respiration in IngWAT of male mice following cold exposure. J O 2 at indicated states was measured following substrate injection. n = 5. (E) Heat rate in isolated mitochondria (state 4, complexes I and II) from IngWAT of male mice following cold exposure. Data are normalized by mitochondrial protein contents. n = 4. (F) Cold tolerance test of male UCP1 KO mice and DKO mice (UCP1 KO × C4orf3 CRISPRi ). The mice were chronically treated with the β3-adrenergic receptor agonist CL316,243 for 5 days to stimulate beige fat biogenesis in both groups. n = 8 per group. Statistic: two-way ANOVA with Šídák’s multiple comparisons test and individual unpaired t tests. (G) Ca 2+ uptake in isolated microsomes from IngWAT of male DKO mice and control UCP1 KO mice at pCa 2+ 6.0. n = 4. (H) SERCA ATP hydrolysis assay in isolated microsomes from (G). The values were normalized by microsomal protein contents. (I) The bioenergetic efficiency of SERCA2 was calculated by Ca 2+ uptake per ATP hydrolysis from (G) and (H). (J) Heat rate in isolated microsomes from IngWAT of UCP1 KO and DKO male mice at pCa 6.0. Thapsigargin was added to calculate SERCA-dependent thermogenesis. n = 4 per group. Statistic (C–E and G–J): unpaired t test. Bars represent the mean and error shown as SEM.
Article Snippet: Ing WAT-specific C4orf3 KD mice were generated by injecting
Techniques: Control, Isolation, MANN-WHITNEY, Expressing, Injection, Hydrolysis Assay

Journal: Cell metabolism
Article Title: Identification of a molecular resistor that controls UCP1-independent Ca 2+ cycling thermogenesis in adipose tissue
doi: 10.1016/j.cmet.2025.03.009
Figure Lengend Snippet: (A) GO pathway enrichment analysis for 276 genes that were uniquely upregulated in IngWAT of DKO mice (UCP1 KO × C4orf3 CRISPRi ) relative to other genotypes following cold exposure. n = 6 per group. (B) Relative mRNA levels of indicated genes in IngWAT of WT control, UCP1 KO, C4orf3 CRISPRi , and DKO mice (UCP1 KO × C4orf3 CRISPRi ) following cold exposure at 6°C for 5 h. Data represented as Z score heatmap for each gene in each sample representing quantitated value. GO terms and pathways for each gene are listed on the right. n = 6. (C) The respiratory exchange ratio of mice at 30°C. n = 7 per group. (D) Quantification of respiratory exchange ratio in (C). Statistic: unpaired t test.
Article Snippet: Ing WAT-specific C4orf3 KD mice were generated by injecting
Techniques: Control

Journal: Cell metabolism
Article Title: Identification of a molecular resistor that controls UCP1-independent Ca 2+ cycling thermogenesis in adipose tissue
doi: 10.1016/j.cmet.2025.03.009
Figure Lengend Snippet: (A) Relative mRNA expression of indicated genes in the subcutaneous adipose tissue of people in . Lean: n = 6 female, n = 3 males; overweight: n = 5 female, n = 4 males; obese classes 1 and 2: n = 6 female, n = 3 males; obese class 3: n = 9 female, n = 1 male; obese with T2D: n = 5 female, n = 4 males. Statistic: one-way ANOVA with Tukey’s post hoc HSD test. (B) Fat mass and lean mass of male C4orf3 CRISPRi and littermate control mice at 30°C on a regular chow diet. n = 10. (C) Daily food intake of mice in (B). (D) Body weight of mice in (B) at 20 weeks old. (E) Indicated tissue weight of male mice on a regular diet at 30°C. n = 11. (F) H&E staining and adipocyte size of IngWAT ( n = 917 cells for control, 623 cells for C4orf3 CRISPRi ) and epididymal WAT (n = 699 cells for control, 364 for C4orf3 CRISPRi ). Male mice at 30°C on a regular chow diet ( n = 3 per group). Statistic: unpaired t test with Welch’s correction. (G) Insulin tolerance test of male C4orf3 CRISPRi mice and controls after 4 h fasting (0.5 U per kg −1 ). n = 8. (H) Fasting insulin levels in male C4orf3 CRISPRi mice and control mice. n = 6. (I) Blood triglyceride (TG) levels in male C4orf3 CRISPRi mice and littermate control mice. n = 6. Statistic (C–E and G–I): unpaired t test. Bars represent the mean and error shown as SEM.
Article Snippet: Ing WAT-specific C4orf3 KD mice were generated by injecting
Techniques: Expressing, Control, Staining
Journal: Frontiers in Immunology
Article Title: Short-Chain Fatty Acids Regulate the Immune Responses via G Protein-Coupled Receptor 41 in Bovine Rumen Epithelial Cells
doi: 10.3389/fimmu.2019.02042
Figure Lengend Snippet: Reverse-transcription PCR primer.
Article Snippet: The
Techniques: Sequencing

Journal: Frontiers in Immunology
Article Title: Short-Chain Fatty Acids Regulate the Immune Responses via G Protein-Coupled Receptor 41 in Bovine Rumen Epithelial Cells
doi: 10.3389/fimmu.2019.02042
Figure Lengend Snippet: Comparisons between RNA-seq and qRT-PCR results.
Article Snippet: The
Techniques: Significance Assay

Journal: Frontiers in Immunology
Article Title: Short-Chain Fatty Acids Regulate the Immune Responses via G Protein-Coupled Receptor 41 in Bovine Rumen Epithelial Cells
doi: 10.3389/fimmu.2019.02042
Figure Lengend Snippet: Characterization of immortal bovine rumen epithelial cells (BRECs). (A) Immunoblotting of SV40T. BRECs: not infected, as negative control, 293T: as positive control, BRECs-SV40T: the infected cells used in the present study. (B) Morphology of immortal BRECs at 1~4 days of culture 100×. (C) Growth curve of immortal BRECs at 1~7 days of culture. (D) Immunoblotting of cytokeratin 18. 3T3-L1 fibroblast, as negative control, 293T: as positive control, BRECs-SV40T: the infected cells used in the present study. (E) RT-PCR analyses of MCT1, MCT4, NHE1, NHE2, NHE3, and GPR41. DNA Marker: 600, 500, 400, 300, 200, and 100 bp. The reverse transcription without reverse transcriptase (RT-, negative control). Data shown are means ± SEM of three independent experiments ( n = 3).
Article Snippet: The
Techniques: Western Blot, Infection, Negative Control, Positive Control, Reverse Transcription Polymerase Chain Reaction, Marker

Journal: Frontiers in Immunology
Article Title: Short-Chain Fatty Acids Regulate the Immune Responses via G Protein-Coupled Receptor 41 in Bovine Rumen Epithelial Cells
doi: 10.3389/fimmu.2019.02042
Figure Lengend Snippet: Generation of GPR41-knocdown (GPR41KD) BRECs cell lines using the CRISPR/Cas9 system. (A) Schematic representation of the GPR41 target gRNA sequences. Arrows represent primer positions. PAM, protospacer adjacent motif. GPR41 primer is used to amplify genomic DNA sequence range between GPR41-gRNA 1 and GPR41-gRNA3. (B) The target GPR41 genomic region PCR products. (C) The screening positive target by Cruiser™ Enzyme. Amplicons digested by Cruiser™ Enzyme were separated in 2% agarose gel electrophoresis. (D) The sequence analysis of positive target. (E) The sequence analysis of TA clone. The deleted sequences in GPR41-knocdown BRECs cell lines are presented. (F) qRT-PCR analysis of GPR41 level in the GPR41-knocdown BRECs. WT, Wild type.
Article Snippet: The
Techniques: CRISPR, Sequencing, Agarose Gel Electrophoresis, Quantitative RT-PCR

Journal: Frontiers in Immunology
Article Title: Short-Chain Fatty Acids Regulate the Immune Responses via G Protein-Coupled Receptor 41 in Bovine Rumen Epithelial Cells
doi: 10.3389/fimmu.2019.02042
Figure Lengend Snippet: Correlations between GPR41 mRNA expression and chemokines, TJ proteins mRNA expression (A,B) . The figure includes data obtained at 24 h from untreated BRECs, 20 mM SCFAs treated BRECs, or 20 mM SCFAs treated GPR41KD BRECs. Data shown are means ± SEM of three independent experiments ( n = 3).
Article Snippet: The
Techniques: Expressing
Journal: bioRxiv
Article Title: Pre-neoplastic stromal cells drive BRCA1-mediated breast tumorigenesis
doi: 10.1101/2021.10.20.465221
Figure Lengend Snippet: a) uMAP projection of cell density by control and BRCA1 +/mut fibroblasts. b) Volcano plot with all differentially expressed genes between control and BRCA1 +/mut fibroblasts. Top 50 BRCA1 +/mut genes were used to define pre-CAF signature. Top 50 control genes define our control Fibroblast Signature. c) Gene signature scoring of all control and BRCA1 +/mut fibroblasts for cancer associated fibroblast (CAF) and iCAF signatures. P-value determined by welch two sample t-test. d) Overall survival Kaplan-Meier analysis of n=1764 patients with a high (n=970) and low (n=794) expression of the pre-CAF signature. e) Overall survival Kaplan-Meier analysis of n=1764 patients with a high (n=1197) and low (n=567) expression of the control fibroblast signature. f) Boxplot of MMP3 expression in control and BRCA1 +/mut fibroblasts. P values are determined using a Mann-Whitney test. g) In situ immunofluorescence (IF) analysis of lobular and ductal regions of breast epithelium in control and BRCA1 +/mut human tissue sections. Scale bar = 50 µm. h) Dot plot showing percentage of MMP3-positive stromal cells in control (blue) and BRCA1 +/mut (red) samples as quantified from IF stainings. P -values were determined using unpaired t-tests.
Article Snippet: Lentiviral particles were packaged and purchased from
Techniques: Expressing, MANN-WHITNEY, In Situ, Immunofluorescence

Journal: bioRxiv
Article Title: Pre-neoplastic stromal cells drive BRCA1-mediated breast tumorigenesis
doi: 10.1101/2021.10.20.465221
Figure Lengend Snippet: a) Pre-CAF gene signature scoring in fibroblasts from individual patients. Libraries with representation of less than 250 fibroblasts were excluded. P -value was determined by a t-test. a) Example immunofluorescence microscopy images from ductal and lobular regions in control tissue samples. Values represent the quantified percentage of stromal cells positive for MMP3. Scale bar = 50 µm. b) Example immunofluorescence microscopy images from ductal and lobular regions in BRCA1 +/mut tissue samples. Values represent the quantified percentage of stromal cells positive for MMP3. Scale bar = 50 µm.
Article Snippet: Lentiviral particles were packaged and purchased from
Techniques: Immunofluorescence, Microscopy

Journal: bioRxiv
Article Title: Pre-neoplastic stromal cells drive BRCA1-mediated breast tumorigenesis
doi: 10.1101/2021.10.20.465221
Figure Lengend Snippet: a) Schematic primary human 3D co-culture using FACS-isolated epithelial cells and fibroblasts modulated using lentiviral transduction. b) Representative images depicting green fluorescent protein (GFP) expression in transduced fibroblasts in close proximity with epithelial organoids (arrow). Scale bar = 100 μm. c) Co-cultures (5 days) of 4,000 breast epithelial cells seeded alone (no fibroblasts) or with 1x10 4 control fibroblasts transduced with lentivirus (+GFP) or transduced to express MMP3 and GFP (+MMP3). Western blots show increased expression of MMP3 in cells and cultured supernatant of +MMP3 fibroblasts (left). Representative merged bright field and GFP images of co-cultures (scale bar= 400 μm) with arrows indicating mammospheres (GFP-negative). Bar charts (right) represent number of mammospheres quantified per well; values expressed as mean ± SD from three separate experiments with three triplicate wells from each. P -values were determined using unpaired t-tests. d) Co-cultures (5 days) of 4,000 breast epithelial cells seeded alone (no fibroblast) or with 1x10 4 BRCA1 +/mut fibroblasts transduced with lentivirus to express CRISPR- Cas9 and MMP3 gRNA (-MMP3) or GFP only (+GFP) vectors. Western blots show decreased expression of MMP3 in cells and medium of MMP3 knock out fibroblast cultures (left). Representative overlay bright field and GFP images of co-cultures (scale bar= 400 μm) with arrows indicating mammospheres (GFP-negative). Bar charts (right) represent number of mammospheres quantified in each well; values expressed as mean ± SD from triplicates of three independent experiments. P - values were determined using unpaired t-tests. e) 1x10 4 FACS-isolated epithelial cells from patient sample “Control 36” were seeded in Matrigel and treated with 0.5 µg/mL or 1 μg/mL recombinant MMP3. Number of mammospheres was quantified after 5 and 10 days. Representative bright field images of mammospheres after 10 days of culture (scale bar= 400 μm). Bar chart values are expressed as mean ± SD from triplicates of three independent experiments. P -values were determined using unpaired t-tests. f) Schematic of mouse model for evaluating effects of stromal fibroblasts (Control 27) on BRCA1-mediated breast tumorigenesis in vivo . g) Images of dissected tumors after six weeks of growth with reported tumor formation efficiencies. Scale bar= 1 cm. P -values were determined using a one- sided Fisher’s Exact test. h) Volumes of dissected tumors. Values are represented as mean ± SD. control n= 4; +GFP n=8, MMP3 n=12. P -values were determined using unpaired t-tests. i) Masses of dissected tumors. Values are represented as mean ± SD. control n= 4; +GFP n=8, +MMP3 n=12. P -values were determined using unpaired t-tests.
Article Snippet: Lentiviral particles were packaged and purchased from
Techniques: Co-Culture Assay, Isolation, Transduction, Expressing, Western Blot, Cell Culture, CRISPR, Knock-Out, Recombinant, In Vivo

Journal: bioRxiv
Article Title: Pre-neoplastic stromal cells drive BRCA1-mediated breast tumorigenesis
doi: 10.1101/2021.10.20.465221
Figure Lengend Snippet: a) FACS plots showing gating strategy for isolation of transduced human fibroblasts with GFP fluorescence in forward and side scatter, singlets gate, GFP gate. b) Representative images of primary mammary epithelial cells cultured alone (control) or with primary mammary fibroblasts transduced with lentivirus to express GFP only (+GFP) or GFP and MMP3 (+MMP3) in Matrigel for 5 days. Fibroblasts are distinguished from epithelial spheres (GFP negative) with GFP fluorescence. Scale bar = 400 μm. c) Quantification of spheres. Values are represented as mean ± SD calculated from nine separate wells per group. P-values were determined by unpaired t-tests. d) Mean values of sphere counts pooled from 3 separate experiments from (b) and . Values are represented as mean ± SD. Statistical significance between all groups was determined with a one-way ANOVA test. e) 10x10 4 FACS-isolated epithelial cells from 4 additional patient samples were seeded in seeded in Matrigel and treated with 0.5 µg/mL or 1 μg/mL MMP3 and spheres were counted after 5 and 10 days. Representative bright field images of mammospheres after 10 days of culture (scale bar= 400 μm). Bar chart values are represented as mean ± SD from triplicates from three separate experiments. P - values were determined using unpaired t-tests. f) Bar graph depicting the fold change in sphere number compared to control (dotted red line) after 10 days of culture with human recombinant MMP3. Bar graph values are expressed as mean ± SD from 15 independent experiments total (5 different patient samples with 3 separate experiments each). g) Primary human breast fibroblasts FACS-isolated from patient sample “Control 27” were transduced to express mouse MMP3 (mMMP3) or GFP only. qPCR analysis was performed on the transduced fibroblasts in two separate trials with three replicates per group. Amplification plot is shown with the difference in the normalized reporter value of the experimental reaction minus the normalized reporter value generated by the instrument (ΔRn) on the y-axis and the cycle number on the x-axis.
Article Snippet: Lentiviral particles were packaged and purchased from
Techniques: Isolation, Fluorescence, Cell Culture, Transduction, Recombinant, Amplification, Generated

Journal: bioRxiv
Article Title: Pre-neoplastic stromal cells drive BRCA1-mediated breast tumorigenesis
doi: 10.1101/2021.10.20.465221
Figure Lengend Snippet: a) Unbiased clustering using uMAP projection of all patient epithelial cells. Cells are labeled by mammary epithelial cell state classification as indicated. b) uMAP feature plots displaying single cell energy in facetted plots for control (upper plot) and BRCA1 +/mut cells (lower plot). c) scEnergy distributions across basal, luminal 1, and luminal2 cell types from control and BRCA1 +/mut samples. Mean scEnergy values from individual patients are plotted. P-value determined by welch two sample t-test. d) Volcano plot displaying genes differentially expressed between control and BRCA1 +/mut luminal 1 epithelial cells. e) Gene signature scoring of luminal 1 cells from control and BRCA1 +/mut epithelial cells for basal, myoepithelial, luminal 2-AREG, and luminal 2-MUCL1 marker gene signatures. P-value determined by Welch two sample t-test. f) In situ immunofluroescence analysis of KRT14/KRT19-double positive cells of lobular and ductal regions in control and BRCA1 +/mut tissues with representative images shown. Bar chart (bottom left) indicates the percentage of K14/K19-double positive cells per field of view in control (n=6) and BRCA1 +/mut (n=6). Values are expressed as mean ± SD quantified from at least 5 random fields per patient sample. P -value was determined using an unpaired t-test. g) Single cell Western blot (scWB)-based quantification of the percentage of KRT23+ in FACS-isolated luminal epithelial cells from n=3 control, and n=3 BRCA1 +/mut . Images are representative regions of scWB chips post electrophoresis and antibody probing. Bar chart values are represented as mean ± SD from at least 1000 cells/individual; n=3 control, and n=3 BRCA1 +/mut . h) Schematic workflow for analyzing co-transplant tumors from in vivo study described in -i for KRT8 and KRT5 expression. i) Representative immunofluorescence images of sections from tumors produced from +GFP control or +MMP3 fibroblast transplants. Yellow staining indicates tumor cells double positive for KRT8 and KRT5. Scale bar= 50 µm. j) Bar chart is a quantification of the percent of KRT5 cells positive from KRT8. Values are represented as mean ± SD from counts from three different tumors per group with at least five random fields per tumor tissue. P -value was determined by an unpaired t-test.
Article Snippet: Lentiviral particles were packaged and purchased from
Techniques: Labeling, Marker, In Situ, Western Blot, Isolation, Electrophoresis, In Vivo, Expressing, Immunofluorescence, Produced, Staining
Journal: bioRxiv
Article Title: Pre-neoplastic stromal cells drive BRCA1-mediated breast tumorigenesis
doi: 10.1101/2021.10.20.465221
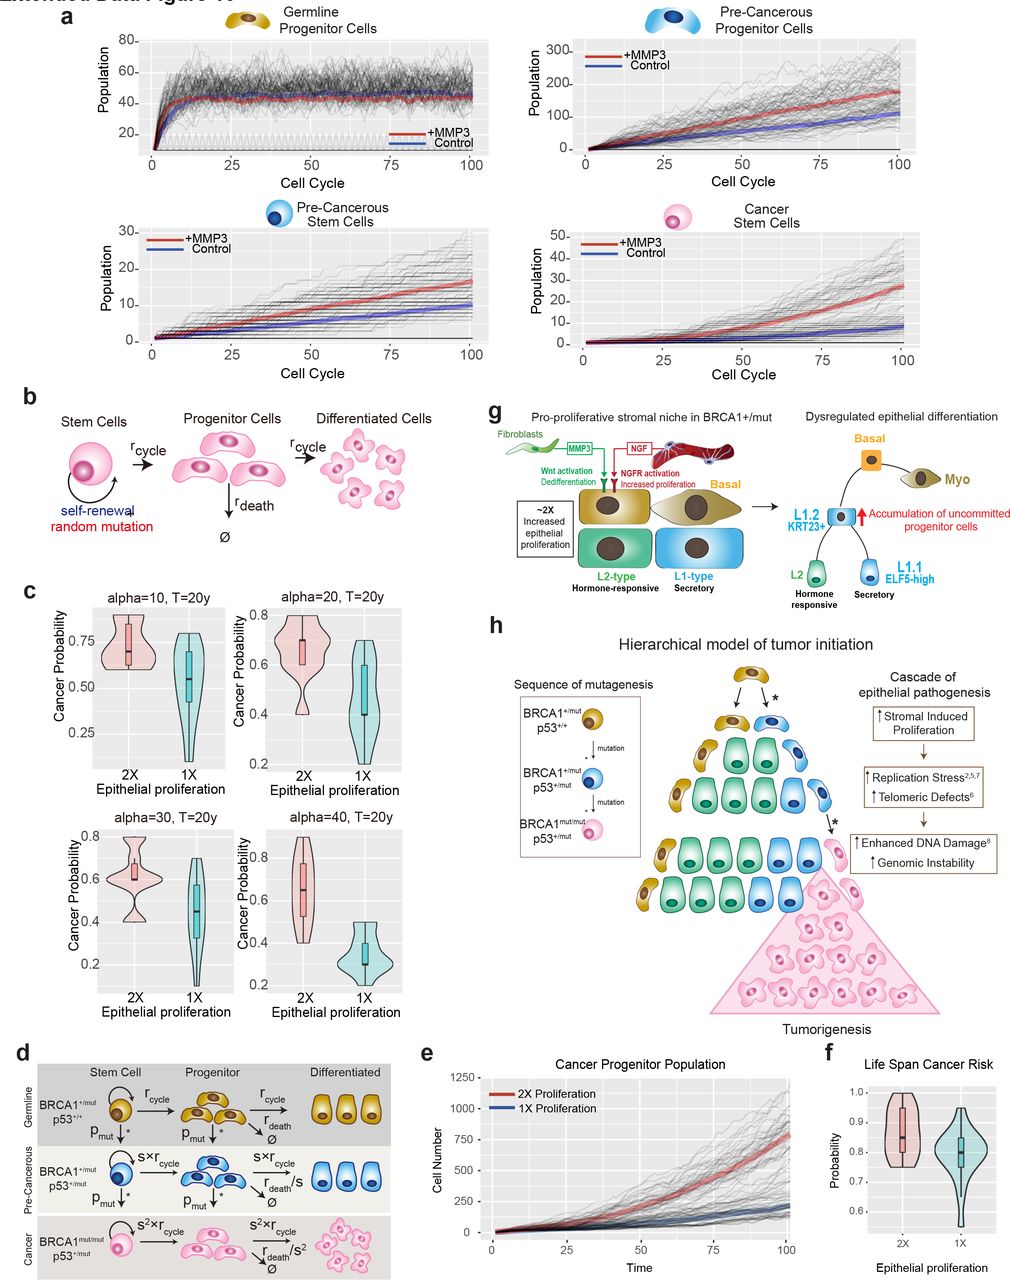
Figure Lengend Snippet: a) The comparison of simulated cell population dynamics in 2 fold increased proliferation and control groups for germline progenitor cells (top left), pre-cancerous progenitor cells (top right), pre-cancerous stem cells (bottom left), and cancer stem cells (bottom right). Thick lines: The averaged population dynamics of 2 fold increased proliferation (red) and control group (blue). Gray thin lines: The stochastic simulation trajectories (sample n=50 for each group). b) Schematic model of the assumptions and parameters used to simulate acquisition of random mutations and consequential fitness change in BRCA1+/mut cells. rcycle is the base line cell division rate, rdeath is the cell date rate. Parameters are further defined in Supplementary Table 10 . c) The robustness of results with respect to parameter alpha in the double-exponential distribution of fitness change ( Supplementary Table 10 ) in the calculation of risk ratio with or without MMP3. The simulation is performed in the time range of 20 years. d) Schematic model illustrating the assumptions and parameters used to simulate the sequential mutations in oncogenes in BRCA1+/mut cells. rcycle is the base line cell division rate, rdeath is the cell date rate, s = proliferation scale factor, pmut is the probability of acquiring a mutation in a driver oncogene. Parameters are further defined in Supplementary Table 11 . e) Comparison between cancer progenitor population dynamics as predicted by a hierarchical model Thick lines: The averaged population dynamics of proliferation in a population with a 2 fold increase in prolifersation and control group (blue). Gray thin lines: The stochastic simulation trajectories (sample n=50 for each group). f) Comparison of the predicted risk ratio of cancer initiation between 2-fold (red) and 1- fold epithelial proliferation rate (blue) in BRCA1 mutation carriers over human life span. The samples are collected from the simulation of N=40 patients in two groups, with the risk ratio of each patient estimated from n=20 simulations of a random mutation model . Violin plots show the distribution of risk ratios over N=20 patients in each group and boxplots indicate median and 25% and 75% quantiles respectively. Wilcoxon Test: *p=0.011. g) Schematic illustrating the concept of a pro-proliferative stromal niche in BRCA1 +/mut breast breast tissues. BRCA1 +/mut stromal cells overepress pro-proliferative cues including NGF in pericytes and pro-tumorigenic MMP3 in fibroblasts (right side). We propose that these act in concert during the pre-neoplastic phase to promote the expansion of a subset of uncommitted luminal progenitor cells as potential cancer cells of origin (left side). h) Concept illustration of the hierarchical model of cancer initiation. Sequence of mutations are indicated in differently colored cells in box on the left, * represent a mutagenic event. Center schematic summarizes outcome of mathematical modeling results indicating expansion of cancer progenitors and ultimately leading to tumorigenesis. Cascade of epithelial cell-intrinsic events promoting tumorigenesis in BRCA1 +/mut is shown on the right. Due to increased stromal cell-induced proliferation and replication stress, BRCA1 +/mut breast epithelial stem cells accumulate mutations and become genomically instable, which increases the likelihood of driver mutations, and ultimately tumor initiation.
Article Snippet: Lentiviral particles were packaged and purchased from
Techniques: Mutagenesis, Sequencing